The history of pig genome research enters the matrix
Media
Image
Blog content
In the TRANSGENE project we are committed to using approaches from different disciplines to make sense of the historical material, and to generate new data from which to form a picture of the genomic research. One of the key approaches is the use of quantitative methods, imported from the social sciences. Mark Wong from the team is leading on this with his work on bibliometric analysis. I have tried to adopt some of the spirit of that work, if not the rigour and extent, as part of my own work analysing pig genome research. So far, I have been working on two matrices, spreadsheets on which to enter numerical values. One is based on data from the website www.lens.org on co-applications for patents containing the term ‘Sus scrofa’, the scientific name for the pig. For the patent-based matrix, I identified a list of people in the pig community from authorship of particular papers and being named as participants in particular research projects. I then entered into the matrix the number of times they had been listed as a co-applicant with other individuals. The source data is flawed, and the resulting data is therefore far from perfect. However, the object of the exercise was not to achieve a perfect record of everything ever patented to do with the pig, but rather to generate a network map depicting the connections between people, and the strength of those connections. Mark ran the matrix through a neat programme called UCINET. I had certain expectations about what the network might look like. I was surprised when it did not match those expectations in a number of areas. Two key surprises are the positions and connections of Graham Plastow and Martien Groenen. Plastow had worked in industry with the Pig Improvement Company (PIC). While at PIC he interacted a great deal with pig genome researchers and so his name comes up in interviews. He was not, however, a co-author of key papers, or a member of certain projects. In this network map, however, he is revealed as a central figure. He is a co-applicant for patents with many other people, who in turn are co-applicants with other people. This shows the power of different kinds of data in revealing connections and collaborations. Collaboration sometimes leaves no tangible trace, or traces that are only revealed by examining different kinds of data. Martien Groenen has been at the heart of pig genome research in Europe and the world. Yet in the patent co-applicant map, he is in a small, separate network. It would be absurd to conclude from this that Groenen was a marginal, poorly-connected figure. So what value is the network map? Its value lies in the reflections that it provokes through a mismatch between expectations and the depiction of the network. It therefore only has value if one has a prior conception of pig genome research and the actors operating in it. It prompts questions as to why certain figures appear well-connected and others do not, and how the nature of their research, or the type of their institution, or the kinds of collaborations that they participate in, shape the data.
James Lowe, February 2017
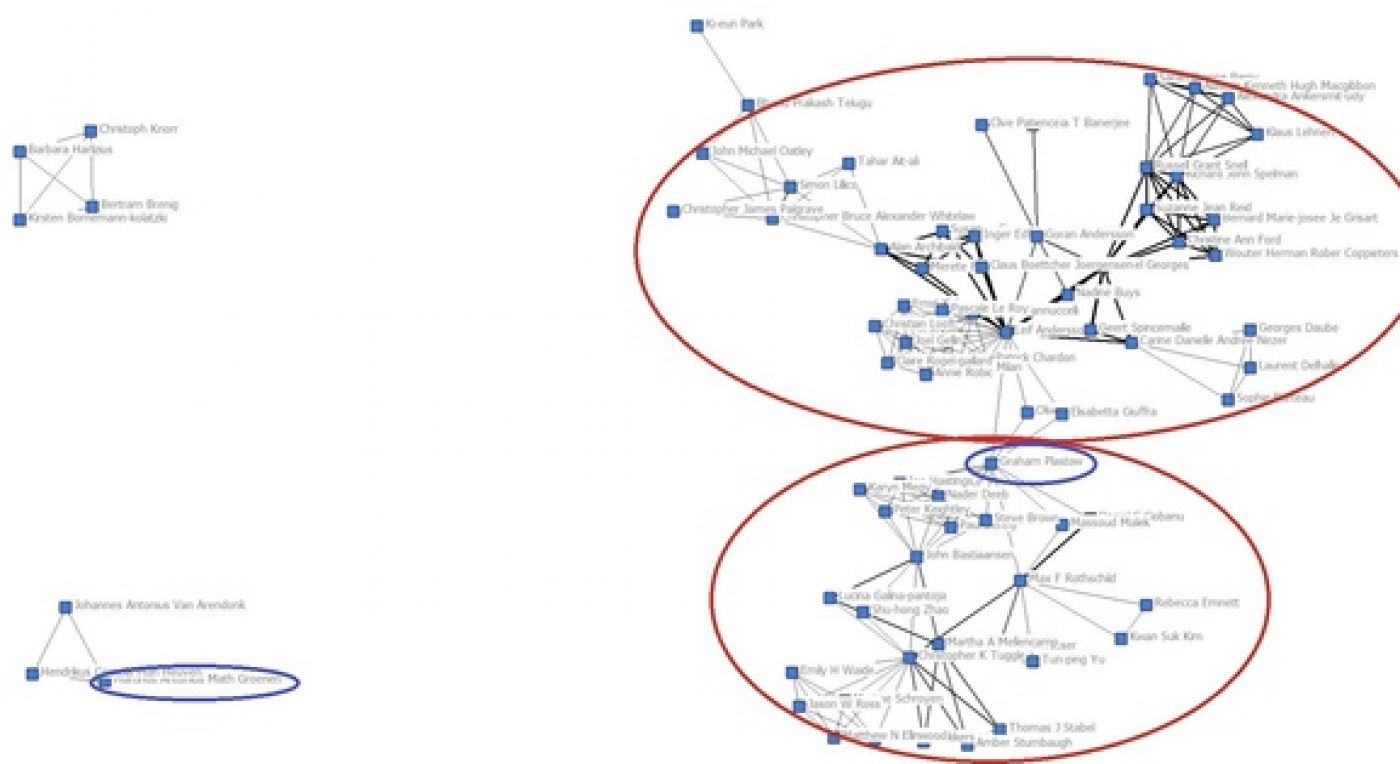
The network map produced using UCINET from data on patent co-applicants obtained from www.lens.org using the search term 'Sus scrofa'. Note the sub-networks that I have circled in red; the upper one contains researchers mostly based in Europe, the lower one contains researchers mostly based in North America. Circled in blue are Graham Plastow, a well-connected former Pig Improvement Company employee, and Martien Groenen, who by other measures is also very well-connected and a central figure in pig genome research.